E5 Matlab 2
11/16/00
In this lab you will again be using MatLab.
Plotting functions
Matlab can be useful as a tool for plotting functions. For example,
lets plot a sinusoidal function.
First, generate a time vector that will be used for plotting.
» t=0:0.1:10;
This generates a vector t that goes from 0 to
10 with an incremental value of 0.1. In other words t=[0 0.1 0.2 ... 9.9
10.0].
Now lets create another vector, x1, that is the sine of t, with a frequency
of 2 radians per second. Then we'll plot
it.
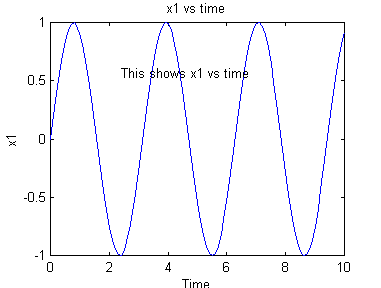
» x1=sin(2*t);
» plot(t,x1);
» xlabel('Time');
» ylabel('x1');
» title('x1 vs time');
» gtext('This shows x1 vs time');
The last statement produces a cursor that allows you to place the text
anywhere you want it. The resulting figure should look like the one
shown below.
Now lets create and plot some more functions. At this point it is
useful to point out that the up-arrow key scrolls through past commands.
If you type a character and then the up-arrow key, it scrolls through past
commands that start with that letter.
» x1=cos(t);
» x2=cos(3*t)/9;
» x3=cos(5*t)/25;
» x4=cos(7*t)/49;
» x5=cos(9*t)/81;
» plot(t,x1,t,x2,t,x3,t,x4,t,x5);
» legend('x1','x2','x3','x4','x5');
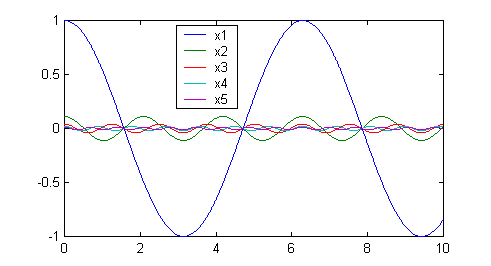
While there is no obvious relationship between these functions, one can be
found. Plot the sum of the 5 vectors; it should represent a triangle
wave. This is a demonstration that any function can be made up of
sine waves.
1) Turn
in a clearly labeled graph of the resulting triangle wave.
In Matlab, it is also possible to work with just parts of arrays.
For example, if we want to plot just the first 50 points of the array x1, we
can use the colon operator, ":", to take indices 1 through 50 (1:50).
» t=0:0.1:10;
» x1=sin(2*t);
» plot(t(1:50),x1(1:50));
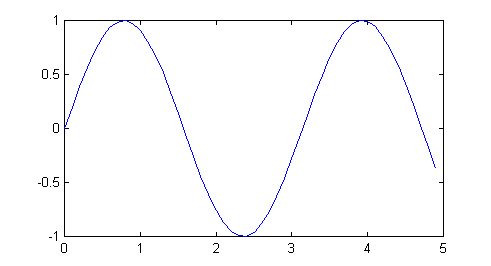
2) Use the
colon operator to plot the function for one period starting near the zero
crossing at 1.57 seconds. Turn in the MatLab command you used, as well as the
graph.
Numerical differentiation in Matlab
Matlab can be used to approximate the process of differentiation.
Let's start with the same vectors as before.
» t=0:0.1:10;
» x1=cos(2*t);
» y=diff(x1)./diff(t);
3) Find out what the "diff()"
function does (» help diff),
and explain why the variable y will be approximately the derivative of x1.
Try plotting the vector y vs the vector t. You'll find
it doesn't work because the vector y is a different length than the vector
t. To see their respective sizes you can type "»
size(y)" and "» size(t)"
or you could use "» length(y)"
and "» length(t)",
since they are one dimensional vectors. To see all variables that are
currently in use, type "» whos".
To fix the size incompatibility problem, make the y
vector one element longer, then we can plot both functions.
» y(length(y)+1)=y(length(y));
» plot(t,x1,t,y);
» legend('cos(2*t)','derivative');
4) Explain how the first of the three
lines fixes the plotting problem.
5) Is the function y what you
expect? Why or why not?
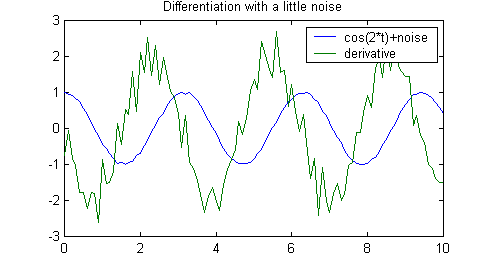
Why we don't normally use numerical differentiation.
Let's add a little bit of random "noise" to the cosine and plot
again. This noise can be from experimental measurements, or just due
to the fact that we can't represent numbers exactly in a computer.
Notice that the signal doesn't look too bad, but the derivative is a mess.
» x=cos(2*t)+0.1*(rand(size(t))-0.5);
» y=diff(x)./diff(t);
» y(length(y)+1)=y(length(y));
» plot(t,x,t,y);
» legend('cos(2*t)+noise','derivative');
» title('Differentiation with a little noise')
» legend('cos(2*t)','derivative');
» title('Differentiation with a little noise')
6) Explain what the first line does.
Numerical integration in Matlab
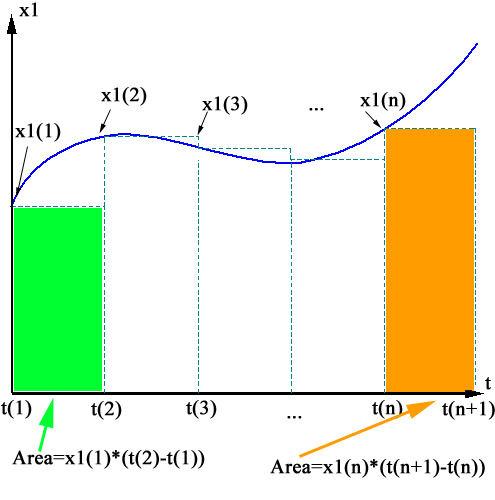
Matlab can also be used to approximate the process of integration, with
more success. The figure below represents the process of
approximating an integral.
Let's start with the same vectors as before.
» t=0:0.1:10;
» x1=cos(2*t);
» y=cumsum(x1.*diff(t));
This generates an error because x1 is incompatible with the vector returned by
diff(), as you can tell by checking their sizes. So we can do the
following:
» y=cumsum(x1(1:(length(x1)-1)).*diff(t));
» y(length(y)+1)=y(length(y));
» plot(t,x1,t,y)
» legend('cos(2*t)','integral')
7) Explain why the variable y
will be approximately the integral of x1. You might want to refer
to the image above when answering.
8) Is the function y what you
expect? Why or why not?
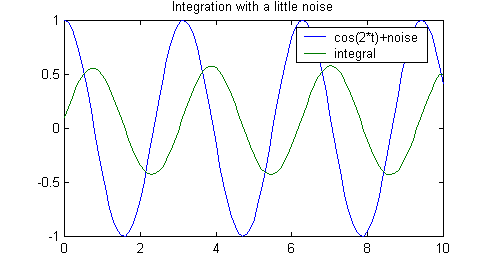
Integrating in the presence of noise.
Let's add a little bit of random "noise" to the cosine and plot
again. Notice that we don't have the same problem as we did with
differentiation.
» x=cos(2*t)+0.1*(rand(size(t))-0.5);
» y=cumsum(x(1:(length(x)-1))).*diff(t);
» y(length(y)+1)=y(length(y));
» plot(t,x1,t,y)
» legend('cos(2*t)+noise','integral');
» title('Integration with a little noise')
9) Explain why numerical
differentiation is inferior to integration in the presence of noise.
To figure this out, consider exactly what it is that both processes do.
Iterating in MatLab
To solve the next problem that we will consider using MatLab, we will need to use a
loop. MatLab has for loops much like C. Go to the MatLab command
window and choose File->New->M-file. Type the following lines into
the window that appears:
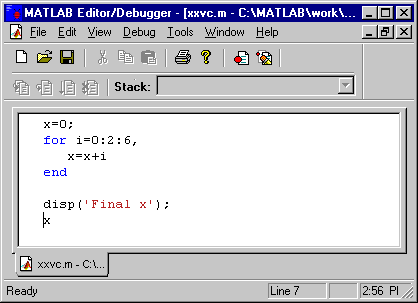
Save the program (File->Save
from the Editor Window), and make sure to give it a
unique name. Now go to Tools->Run (also
in Editor Window). If you go back to the MatLab
command window, it looks like this:
x =
0
x =
2
x =
6
x =
12
Final x
x =
12
The for loop iterates the variable i from 0 to 6 with
an increment of 2. The syntax is
for variable=start:increment:finish,
... matlab commands ...
end
Simulating Physical Systems in MatLab
Applying Numerical Integration
In all branches of engineering computers are used to simulate
complex problems. In this exercise we will use MatLab and numerical
integration to simulate a falling object.
Consider a falling object. If the object is in a vacuum,
the acceleration of the object is equal to the gravitational constant, g (9.8
m/s2). But in the real world there is also a retarding force
on the object due to air friction. This force is called drag. To a
first approximation, let us assume that drag is proportional to the velocity
of the object such that Fdrag=bv. In this equation "Fdrag"
is the drag force, "v" is the velocity and "b" is the
proportionality constant between velocity and drag. So the object now
has two forces on it, gravity (Fg) and drag.
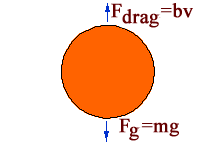
The sum of forces on a body is equal to mass times
acceleration, so we get
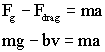
we can now solve for acceleration.

10) In the presence of friction, the
object will reach a steady (or terminal) velocity. What is the terminal
velocity in terms of g, b, and m?
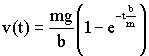
If we can figure out the acceleration we can obtain the
velocity by simply integrating it. The following code performs this
approximate integration. Make sure you understand how it works.
You can cut and paste it into the MatLab editor. Let us assume that the
mass starts at rest, and has a mass of 1 kg. The friction coefficient,
b, is set to 0.1. Note that comments are marked by a percent
sign, "%"
|
clear all;
%delete
all the old variables
v0=0;
%Initial
velocity
dt=0.1;
%This
is our time step
t=0:dt:60;
%Simulate
for ten seconds.
g=9.8;
%gravitational
constant
b=0.1;
%friction
coefficient.
m=1;
%mass is 1
kg.
v(1)=v0;
%Set initial
velocity.
for i=1:1:(length(t)-1),
a=g-(b/m)*v(i);
%Calculate acceleration.
v(i+1)=v(i)+a*dt;
%Get velocity
by approximate
integration.
end
%Exact
Solution.
vexact=(m*g/b)*(1-exp(-t*b/m));
plot(t,v,t,vexact);
legend( 'Approx
v','Exact
v');
xlabel( 'Time');
ylabel( 'Velocity'); |
We used MatLab to do a simulation, but you will learn in later
math classes that the exact solution is given by:
11) Try setting the time step, dt, to
1. And look at the results. Now set it to 10. Explain why
the simulated solution gets worse relative to the exact solution.
In reality the drag force is better modeled as being proportional to the
velocity squared (though this makes finding the exact solution much harder):

Revise the code so that it simulates the new drag force. Remove
the sections of the code that calculate and plot the exact response (which
are only accurate for drag that is proportional to velocity).
12) Plot velocity vs. time with the
revised formula for drag force.
If you want you can try varying the drag coefficient b. If it is very
low, it is like falling in a vacuum. If you make it higher, it is like
falling through syrup.
Extra - the trajectory of an object
with friction.
You only need to do this if
you have time -- but if you do have time, you should do this.
There is a 1 mass projectile, moving in two dimensions, with
initial velocities
vx(0)=50 m/sec, to the right, and
vy(0)=50 m/sec upward
and drag coefficient, b=0.1.
13) Plot vx(t) vs. time, and
vy(t) vs. time. Also turn in the MatLab you used (with
comments).
This isn't quite as easy as it seems at first. The force due to the
drag is proportional to the total velocity of the projectile, and is in a
direction opposed to the motion of the projectile. So first you'll have
to find the magnitude of the velocity, and then use that to find the magnitude of
the drag force. Then you can resolve the drag force into its x and y
components, and use that information to find the acceleration in the x and y
directions.
To do this you'll need the square root function, "sqrt()".
14) Plot the trajectory of the object.
Also turn in the MatLab you used (with comments).
You'll have to use vx(t) and vy(t) to find x(t) and y(t), then plot x(t) vs y(t).