The Land Use Planning Committee (LUPC) has collected data from many sources to inform the discussion of land use issues.
Figure 1: A graph of enrollment data from every source that the LUPC and the Office of Institutional Research have been able to find concerning Swarthmore College enrollments since its founding in 1864. Some sources count study-abroad students as enrolled at the College; others do not. If you have additional data to add to this figure, please contact the Land Use Planning Committee via the link at the bottom of the page.
(click on the above figure to download a PDF version of it)
Figure 2: A version of the data in Figure 1 plotted with the best-fit straight line through all points. In this calculation, all data were considered equally valid. The regression equation has a slope of approximately 11.2 students/year, which is the average enrollment growth at Swarthmore College over its history based upon these data. The correlation coefficient is 0.97, indicating a very good fit of the line to the data. Thus, discussions of past enrollments should refer to linear, not exponential, enrollment growth.
(click on the above figure to download a PDF version of it)
Click here to download a PDF file of a document, presented at a faculty lunch by the LUPC, showing data on "square feet under roof" for Swarthmore College in comparison to 18 schools in a 1998 COFHE study.
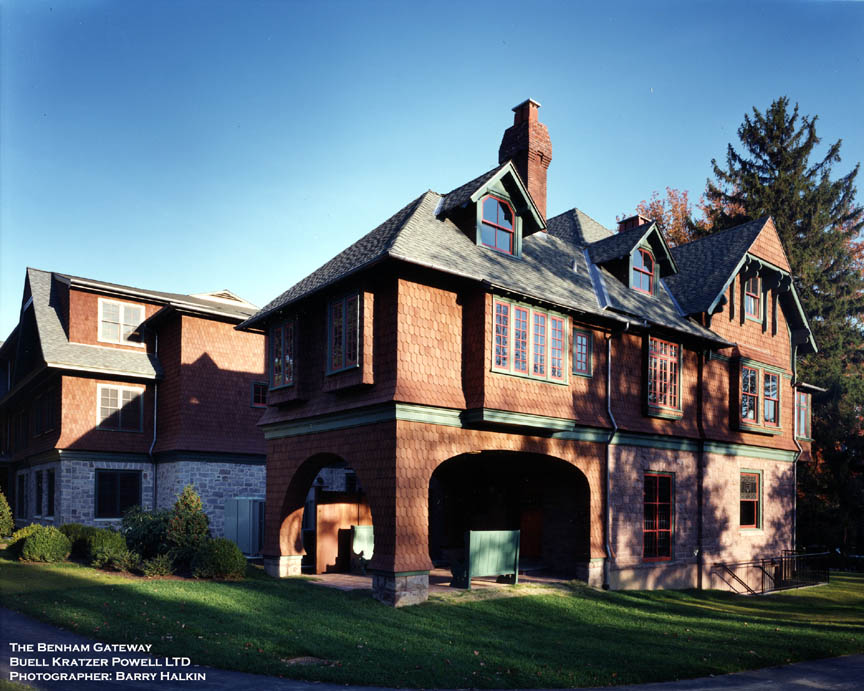
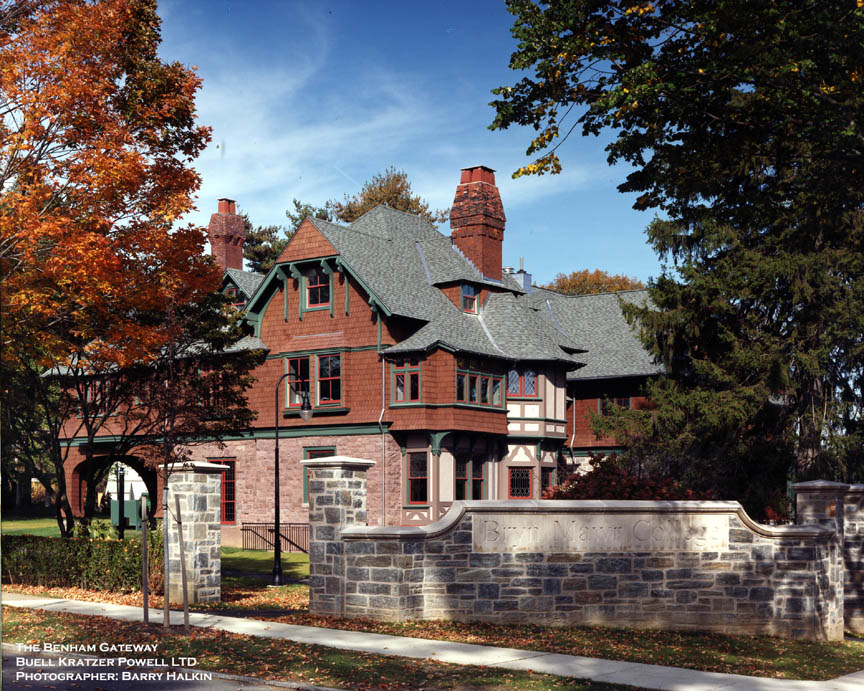
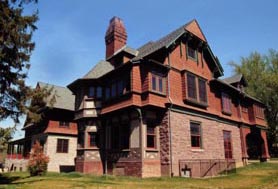
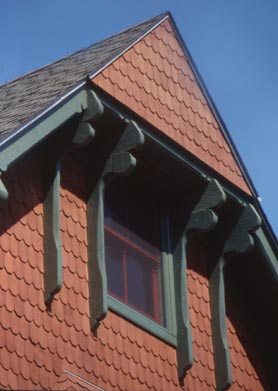
Examples of "contextual scale" buildings on Swarthmore's campus include Pittenger, Palmer, and Roberts, and on Bryn Mawr College's campus, the Benham Gateway building:
Benham Gateway at Bryn Mawr College (for more information about Bryn Mawr's campus, click here):
Return to Swarthmore College homepage
Send message to Land Use Planning Committee
last updated 10/6/02
webmaster